Home »
Please feel free to download the images and to use the statistics on this page.
To save the images, right click the mouse and then click on Save image as…

What Do Learners Want?
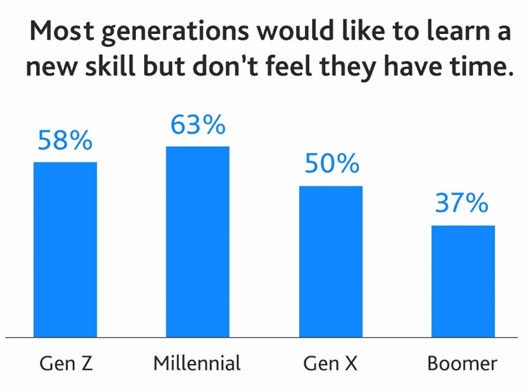
Source: LinkedIn’s 2019 Workplace Learning Report. 2,100 Staff Surveyed.
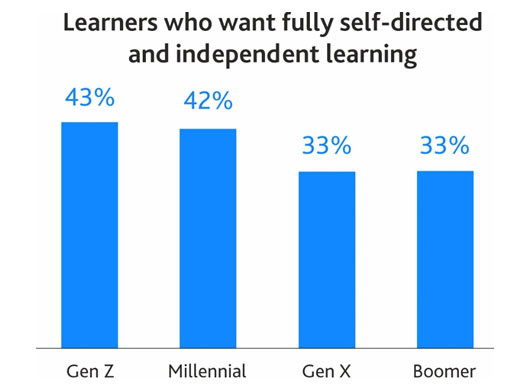
Source: LinkedIn’s 2019 Workplace Learning Report. 2,100 Staff Surveyed
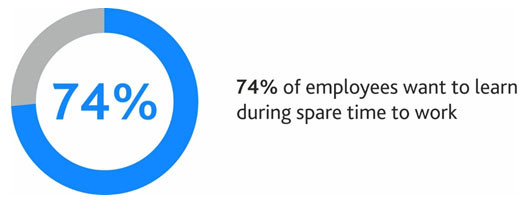
Source: LinkedIn’s 2019 Workplace Learning Report. 2,100 Staff Surveyed
Benefits Of Personalised Learning
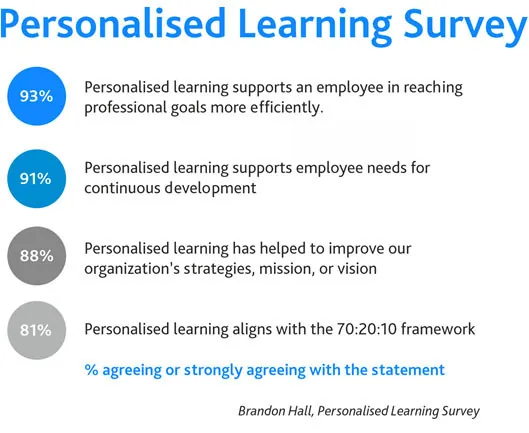
Wellbeing – Less Time, More Pressure
YouGov data from more than 4,000 employees was used to form the basis of Business in the Community’s (BITC) “Mental Health at Work 2019 Report – Time to Take Ownership” and some of the research from the report was startling.
Here are some relevant statistics:
52%
36%
35%
Technology Trends & Usage Patterns
- The average smartphone user uses their phones for more than 4 hours a day Themanifest
- 71% of teenagers watch an average of over 3 hours of videos online daily. Thinkwithgoogle
- 52% of all teens now use at least one messaging apps. Thinkwithgoogle
- 1 in 5 adults uses mobile voice search at least once every month. Global Web Index
- 48% of the buyers use smartphones as the first point of contact to start their search. Thinkwithgoogle
- Global: 62% of users accessed the internet using their mobile phones. Statista
- Global: In November 2018, Statisa measured that, mobile devices accounted for 48.2% of website traffic worldwide (excluding tablets). Statista
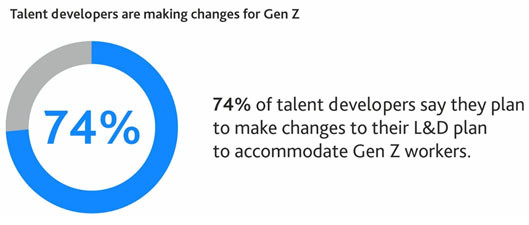
Spending Trends from 2017-2019
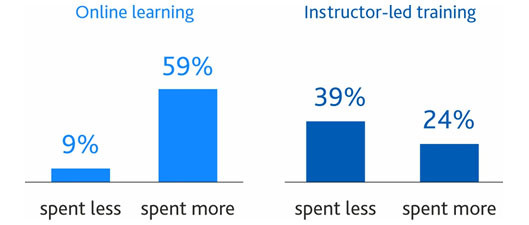
Source: LinkedIn’s 2019 Workplace Learning Report. 2,100 Staff Surveyed
AI & Learning
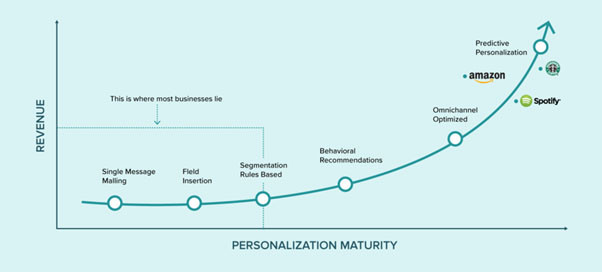

35%
Of Amazon’s conversions are powered by its AI recommendation engine
Source: McKinsey
